CV/Pseudocapacitance Analysis: b-Value Kinetic Analysis
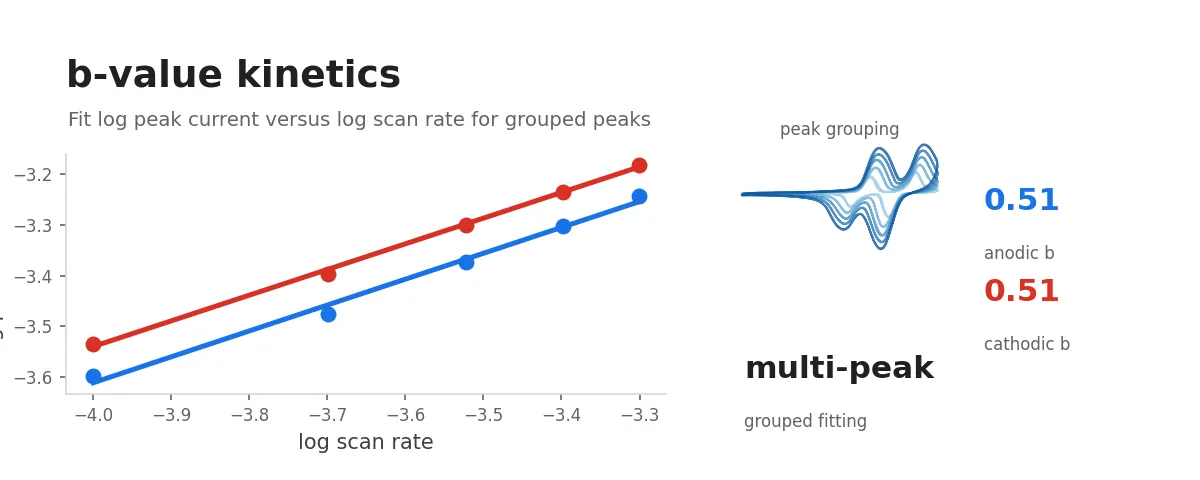
This workflow uses CV data recorded at different scan rates to extract peak currents, or midpoint-potential currents when no peak group is available, and calculates b values by power-law fitting to determine the kinetic control mechanism of the electrode reaction.
Input Data
Select a folder containing instrument-exported raw CV data, or multi-select a group of raw CV data files.
The dataset should contain CV curves at multiple different scan rates to ensure statistical significance of the fitting.
Procedure
- Select input data: choose a folder containing CV data at different scan rates, or multi-select a group of data files.
- The system automatically detects candidate peaks, groups peaks across scan rates by scan branch and peak position, and performs b-value fitting separately for each valid peak group.
- The workflow outputs a grouped kinetic analysis plot in log-log coordinates and a preview figure annotating the sampling locations and peak-group labels in each scan-rate file.
Scientific Principles
Power-Law Relationship
In cyclic voltammetry, the peak current (or the current at a specific potential) and the scan rate satisfy a power-law relationship:
where is a constant and is the kinetic exponent. Taking the logarithm of both sides yields the linear form:
Physical Significance of the b Value
The value is used to determine the rate-controlling step of the electrode process:
| Value | Control Mechanism | Physical Significance |
|---|---|---|
| Diffusion-controlled | Current is limited by the diffusion rate of reactants in solution | |
| Surface-controlled (capacitive behavior) | Current is dominated by surface adsorption/desorption processes | |
| Mixed control | Both diffusion and surface processes contribute |
Current Selection Strategy: Multi-Peak Detection, Cross-Scan-Rate Grouping, Per-Group Fitting
For the two one-directional scan segments of the last complete cycle in each scan-rate file, this workflow first extracts candidate peaks and then groups peaks across scan rates that correspond to the same electrochemical process. Only peaks within the same group are used in the same b-value fit.
Candidate peak detection:
scipy.signal.find_peaksis called on both and for each segment, covering instrument sign-convention differences for oxidation/reduction currents. A candidate peak must satisfy:- Peak prominence ≥ 5% of the within-segment current range;
- Peak position at least 5% of the segment length away from either endpoint, rejecting startup spikes and truncation artifacts;
- Peak height (measured both against the peak’s own current and against the largest absolute current in the segment) must exceed a threshold. An ideal capacitive CV is close to rectangular and shows no clear bumps, so it is filtered out by this rule; only segments where a real oxidation/reduction peak “bumps out” of the curve are kept.
- The number of candidates per segment is capped at a hard upper bound; extras are dropped in order of decreasing prominence.
Peak-group assignment: The anodic branch (
ia) and cathodic branch (ic) are grouped independently; visually symmetric oxidation/reduction peaks are not merged automatically. Grouping uses potential proximity, potential order, and peak prominence. The number of valid peak groups per branch is also capped. Group IDs are named asia_p01,ia_p02,ic_p01, and so on.Missing peaks: If a scan rate does not contain a member of a peak group, that scan rate is missing from the group. The midpoint current or another peak is not used as a replacement.
Midpoint fallback: If an entire branch does not form any valid peak group, the current at the midpoint of the potential window is used as a fallback group:
Fallback group IDs are
ia_mid_eandic_mid_e.Fitting requirement: A peak group must contain at least 3 distinct scan rates and appear in at least half of all scan-rate files to report a b value. Groups that don’t qualify are kept in the output with status
insufficient_points. If every peak-path group of a branch fails this requirement, the whole branch falls back to mid_e.
Fitting Method
Least-squares linear fitting is performed in the – space for each valid peak group, yielding that group’s b value and goodness-of-fit .
Output
| File | Content |
|---|---|
kinetic_plot.png | Grouped log-log scatter plot with fitting lines. The anodic and cathodic branches are shown as separate panels. Each peak group has its own data points and fitted curve; the legend lists the group ID, center potential, b value, , and number of scan rates used |
sample_points.png | Sample point preview. One subplot per scan-rate file shows the CV curve of the last complete cycle. The two one-directional scan segments are drawn in blue (seg1) and orange (seg2). Candidate peaks are marked with small × symbols, colored consistently with the peak groups in kinetic_plot.png; a gray dashed line marks ; ungrouped candidates are shown as gray open circles. Supports visual sanity-checking of peak-group assignment |
b_raw_data.csv | Raw fitting data, a long-form table where each row represents one sample point for one peak group in one scan-rate file |
b_fit_summary.csv | Fit summary, one row per peak group, including group ID, branch, center potential, potential range, number of points, number of scan rates, b value, , and status |
b_fit_curves.csv | Fitting curve data, one fitted-current column per valid peak group |
b_peak_candidates.csv | Candidate peak data, all segment-level candidate peaks that pass filtering, including their group assignment status |
b_raw_data_legacy.csv | Legacy wide-form data, one row per scan-rate file, containing only the first valid group or midpoint fallback group for each branch |
kinetic_analysis.opju | Origin project, available when Origin is enabled. Each valid group has its own scatter points and fitted line, and a text label lists the corresponding b value, , and number of scan rates used |
Both kinetic_plot.png and sample_points.png are displayed in the Workflow UI and saved to the output folder.
Subsequent Analysis
- CV/Cdl: Double-Layer Capacitance and Electrochemically Active Surface Area Analysis: performs linear fitting based on midpoint current differences across scan rates to calculate the electrochemically active surface area (ECSA)
- CV: Coulombic Efficiency and Capacitance Calculation: evaluates the reversibility of electrode reactions
References
- Simon, P., Gogotsi, Y., and Dunn, B. (2014). Where do batteries end and supercapacitors begin? Science 343, 1210-1211. DOI: 10.1126/science.1249625.
- Lindstrom, H., Sodergren, S., Solbrand, A., Rensmo, H., Hjelm, J., Hagfeldt, A., and Lindquist, S.-E. (1997). Li+ ion insertion in TiO2 voltammetry on nanoporous films. J. Phys. Chem. B 101, 7717-7722. DOI: 10.1021/jp970490q.