CV/Dunn: Capacitive / Diffusion Contribution Ratio
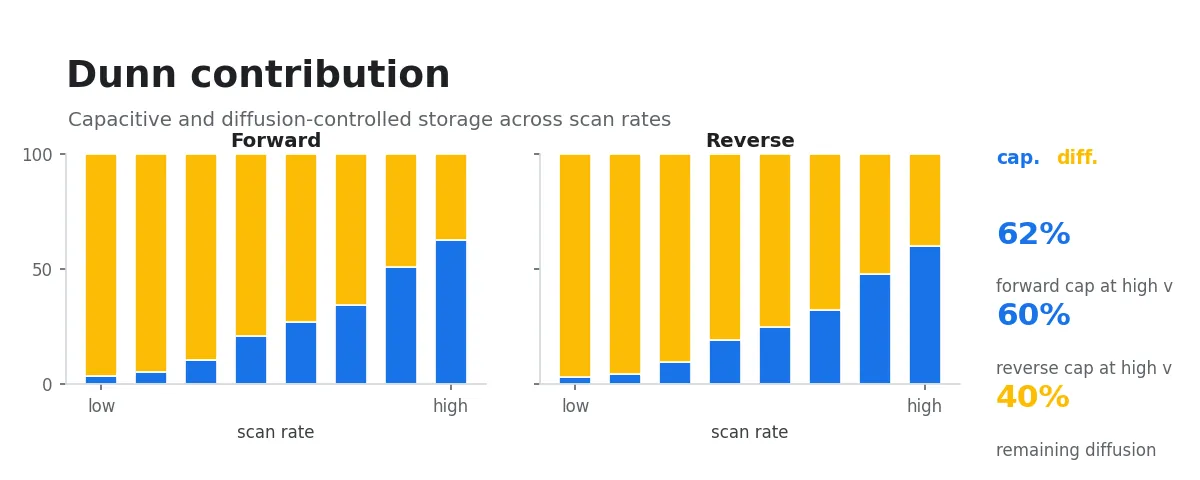
This workflow directly accepts a folder or multiple files of raw instrument-exported CV data. It separates / contributions of CV curves at different scan rates using Dunn’s method, computes the capacitive versus diffusion-controlled contribution ratio, and produces stacked bar charts (matplotlib + Origin).
Prerequisites
The input should contain CV curves at multiple scan rates. Select raw CV data from CHI, DigiSim, EC-Lab MPR, mdat Excel, or two-column text/CSV sources.
Dunn’s method relies on the relationship across multiple scan rates. We recommend at least 3 distinct scan rates whose potential windows share a common intersection. The input may be pseudocapacitive materials (mixed capacitive + diffusion control) or purely capacitive baselines.
Procedure
- Select input data: Choose a raw CV data folder, or directly select a group of raw data files. Each file should correspond to one scan rate.
- The system automatically aligns all curves on the intersection of their potential axes and fits at each potential, yielding (capacitive coefficient) and (diffusion coefficient).
- For each scan rate it computes the capacitive and diffusion contribution ratios and draws two side-by-side stacked bar charts for the forward and reverse scans.
- The workflow outputs the bar chart, a contribution CSV, a / distribution CSV, and a text report.
- To create an Origin project, click the “确认生成” button. Origin export is slow, so it does not run automatically when data changes.
Scientific Principles
Dunn’s method assumes that the current at each potential is a linear superposition of a capacitive current and a diffusion current:
where:
| Symbol | Meaning | Unit |
|---|---|---|
| Current at a given potential | A | |
| Scan rate | V/s | |
| Capacitive current coefficient | F or A·s/V | |
| Diffusion current coefficient | A·s/V |
Dividing both sides by gives the linear form:
For each potential , linearly regress against . The slope is and the intercept is .
For each scan rate :
- Capacitive current
- Diffusion current
The contribution ratio is computed by potential-integrated area:
The diffusion ratio is .
Compared with a single-point ratio (e.g. at the midpoint potential), the integrated-area method is more robust to noise and reflects the average contribution over the whole potential window.
Output
| File | Content |
|---|---|
dunn_bar_chart.png | Horizontal 100% stacked bar chart: one subplot for forward scan and one for reverse scan, showing capacitive and diffusion contribution ratios at different scan rates |
dunn_presentation_chart.png | Presentation-style contribution figure matching the workflow cover visual style, suitable for reports, previews, and quick reading |
dunn_result.csv | Capacitive and diffusion ratios for forward and reverse scans at each scan rate |
dunn_k_distribution.csv | and at each potential, annotated by branch |
dunn_report.md | Text-form result report |
dunn_analysis.opju | Origin project, generated when “确认生成” is clicked and Origin is available; contains two stacked column graphs (forward and reverse) |
dunn_bar_chart.png and dunn_presentation_chart.png are displayed in the workflow UI and saved to the output folder.
Applicable Scope
This workflow applies to multi-scan-rate CV data for separating capacitive and diffusion contributions, commonly used in pseudocapacitive materials and charge-storage-mechanism analysis of energy-storage devices. If fewer than 3 scan rates are supplied or their potential windows do not intersect, the workflow reports the error and stops.
Dunn’s method assumes the capacitive current is strictly proportional to and the diffusion current strictly proportional to . For CV data involving phase transitions, precipitation reactions, or strongly non-linear kinetics, the results are only a reference.
Subsequent Analysis
- CV/Pseudocapacitance Analysis: b-Value Kinetic Analysis: Fits to distinguish diffusion control (), surface control (), or mixed control
- CV/Cdl: Double-Layer Capacitance and Electrochemically Active Surface Area Analysis: Computes from midpoint-current differences, cross-checking against from Dunn’s method
- CV/Randles-Sevcik: Diffusion Coefficient Calculation: Computes the diffusion coefficient from peak currents
References
- Pu, X., Zhao, D., Fu, C., Chen, Z., Cao, S., Wang, C., and Cao, Y. (2021). Understanding and Calibration of Charge Storage Mechanism in Cyclic Voltammetry Curves. Angew. Chem. Int. Ed. 60, 21310-21318. DOI: 10.1002/anie.202104167.
- Brezesinski, T., Wang, J., Tolbert, S.H., and Dunn, B. (2010). Ordered mesoporous alpha-MoO3 with iso-oriented nanocrystalline walls for thin-film pseudocapacitors. Nat. Mater. 9, 146-151. DOI: 10.1038/nmat2612.