CV: Plot the Last Complete Cycle
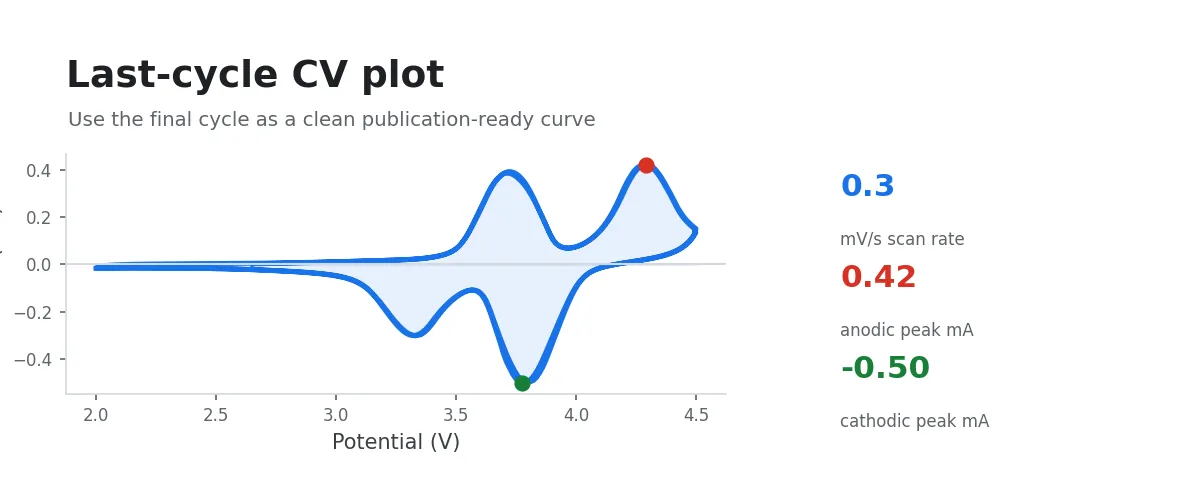
This workflow extracts the last complete cycle at each scan rate from multi-cycle CV data and overlays the steady-state CV curves from different scan rates on a single plot for intuitive comparison of electrochemical response characteristics across scan rates.
Input Data
Select a folder containing instrument-exported raw CV data, or multi-select a group of raw CV data files.
Procedure
- Select input data: choose a folder containing CV data, or multi-select a group of data files.
- The system automatically extracts the last complete cycle from each file and generates an overlaid CV plot.
Principle
In cyclic voltammetry experiments, the electrode typically reaches an electrochemically stable state after multiple scan cycles. The CV curve from the last cycle is considered to best represent the intrinsic electrochemical behavior of the material at a given scan rate, and is therefore commonly used as the standard data for comparing responses across different scan rates.
Selection of the Last Complete Cycle
The system reads the Scans_Split worksheet and checks whether the last set of scan segments (the last 4 columns) contains complete forward and reverse scan data:
- If the last cycle is complete (both forward and reverse scans contain data), it is used directly.
- If the last cycle is incomplete (containing only a unidirectional scan), the system falls back to the penultimate cycle.
Curve Concatenation and Plotting
For each scan rate, the potential–current data from the forward scan and reverse scan are concatenated end-to-end to form a complete, closed CV curve. Curves at different scan rates are distinguished by a colormap, and the legend automatically labels the corresponding scan rate (the display unit—V/s, mV/s, or μV/s—is selected automatically based on the numerical magnitude).
Output
- Overlaid CV plot (potential versus current), with Potential (V) on the x-axis and Current (A) on the y-axis.
- The image is saved in PNG format to the input folder.
Subsequent Analysis
Based on visual observation of the last-cycle data, you can proceed with the appropriate analysis path:
- CV: Coulombic Efficiency and Capacitance Calculation: calculate coulombic efficiency at each scan rate
- CV/Pseudocapacitance Analysis: b-Value Kinetic Analysis: perform pseudocapacitive b-value kinetic analysis